This web page was produced as an assignment for Genetics 564, an undergraduate course at UW-Madison .
What is phylogeny?_______________________________________________________________________________
Phylogeny concerns the evolutionary relationships between species and how closely related they are.
Phylogenetic trees provide visual representations of these relationships: As summarized in the diagram below, the tips of the trees each represent one species, and a node represents a common ancestor from which the species at the tips descended. When different species (or daughter lineages) are descended from the same common ancestor, they are known as sister groups. Sister groups are always the same age since they arose from the same ancestor at approximately the same time. The outgroup is the species that is not as closely related to members of a group of interest. The branch lengths of a tree represent the number of nucleotide substitutions divided by the length of a sequence. The longer the branch, the higher the number of changes in the organism's genome in relation to another organism's genome in the tree [1].
Generating phylogenetic trees______________________________________________________________________________
Step 1
Obtain and format homologous protein sequences from different organisms. An example using DRD2 protein sequences of how the formatting is done is illustrated in the following document:
Obtain and format homologous protein sequences from different organisms. An example using DRD2 protein sequences of how the formatting is done is illustrated in the following document:
| sequenceformatting_drd2.docx |
|
Step 2
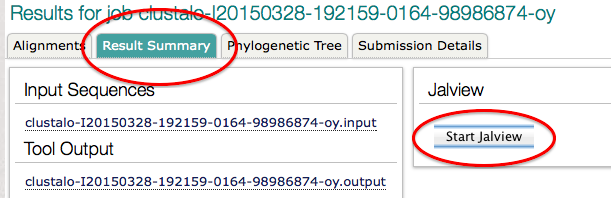
Align the sequences by pasting them into a multiple alignment program like Clustal Omega. In order to vizualize and analyze the alignments, the free plugin software Jalview can be used. Once Jalview has been downloaded and installed, the 'Result Summary' tab on the output page of Clustal Omega will display the option to start Jalview, as illustrated below: |

|
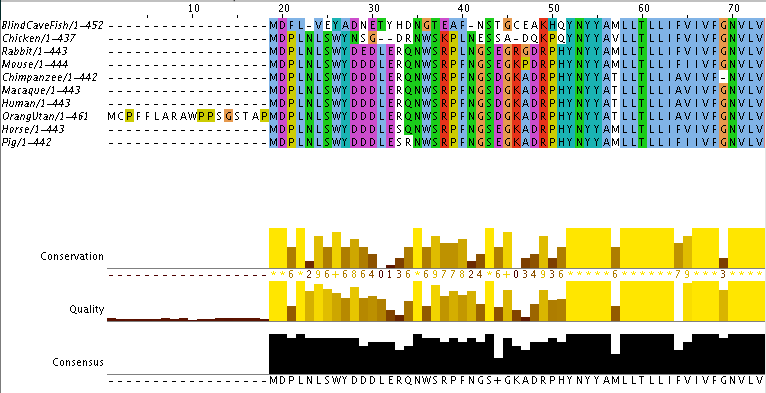
Results would look similar to the following image:
Step 3
Average distance trees and neighbour joinign trees can be generated in Jalview by clicking on Calculate>Calculate Tree.
Average distance trees and neighbour joinign trees can be generated in Jalview by clicking on Calculate>Calculate Tree.
How are the trees generated?_______________________________________________________________________________
First, similarity scores are calculated. This is achieved by either the BLOSUM matrix or percentage identity.
A BLOSUM matrix is used to score alignments between pairs of protein sequences. The numbers in BLOSUM matrices are based on the different probabilities of each amino acid aligning. Jalview uses the BLOSUM62 matrix, which can be viewed here. For generating a tree, a score is assigned to each amino acid pair. The scores are then added up. The higher the score, the more closely related the sequences are.
The percentage identity method involves what percentage two sequences are identical to each other. It is essentially the number of equivalent aligned amino acids per 100 amino acids [2].
An average distance tree assumes that the rate of evolution is constant across lineages. A distance matrix with similarity scores representing how closely related the species are is used to generate the tree [3].
In generating a neighbour joining tree, an algorithm to generate a tree with the shortest possible branch lengths is applied.
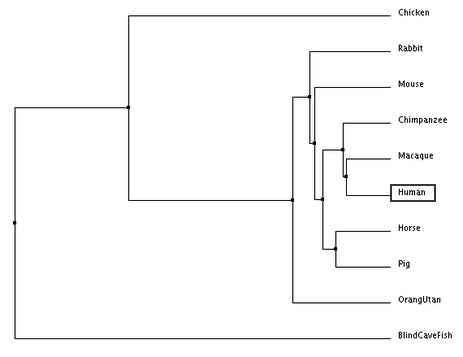
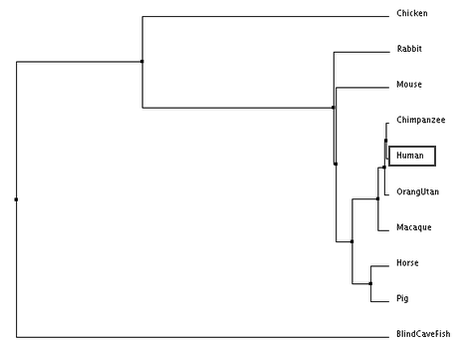
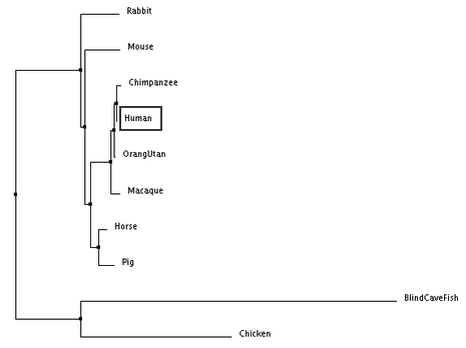
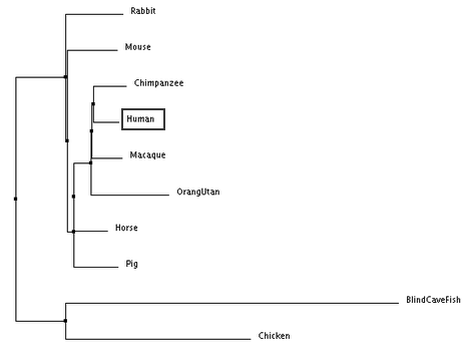
The following trees for comparing DRD2 protein sequence similarity between species were generated:
First, similarity scores are calculated. This is achieved by either the BLOSUM matrix or percentage identity.
A BLOSUM matrix is used to score alignments between pairs of protein sequences. The numbers in BLOSUM matrices are based on the different probabilities of each amino acid aligning. Jalview uses the BLOSUM62 matrix, which can be viewed here. For generating a tree, a score is assigned to each amino acid pair. The scores are then added up. The higher the score, the more closely related the sequences are.
The percentage identity method involves what percentage two sequences are identical to each other. It is essentially the number of equivalent aligned amino acids per 100 amino acids [2].
An average distance tree assumes that the rate of evolution is constant across lineages. A distance matrix with similarity scores representing how closely related the species are is used to generate the tree [3].
In generating a neighbour joining tree, an algorithm to generate a tree with the shortest possible branch lengths is applied.
The following trees for comparing DRD2 protein sequence similarity between species were generated:
|
|
|
Average distance tree using % identity
|
Average distance tree using BLOSUM62
|
|
|
|
Neighbour joining tree using % identity
|
Neighbour joining tree using BLOSUM62
|
Discussion______________________________________________________________________________________
According to all four trees, the blind cave fish DRD2 sequence is the most distantly related. In the trees generated, humans and primates (chimpanzee, macaque and orang utan) are consistently seen to be closely related as they are grouped together in one clade. An exception is the average distance tree calculated using percentage identity, where the orang utan is part of an outgroup. This shows how much phylogenetic trees can vary and that one should not rely on only one calculation method.
According to all four trees, the blind cave fish DRD2 sequence is the most distantly related. In the trees generated, humans and primates (chimpanzee, macaque and orang utan) are consistently seen to be closely related as they are grouped together in one clade. An exception is the average distance tree calculated using percentage identity, where the orang utan is part of an outgroup. This shows how much phylogenetic trees can vary and that one should not rely on only one calculation method.
References
[1] Reading trees: A quick review. http://evolution.berkeley.edu/evolibrary/article/phylogenetics_02
[2] Calculation of trees from alignments. http://www.jalview.org/help/html/calculations/tree.html
[3] Phylogenetic Reconstruction. http://evolution-textbook.org/content/free/contents/ch27.html#ch27-4-2
